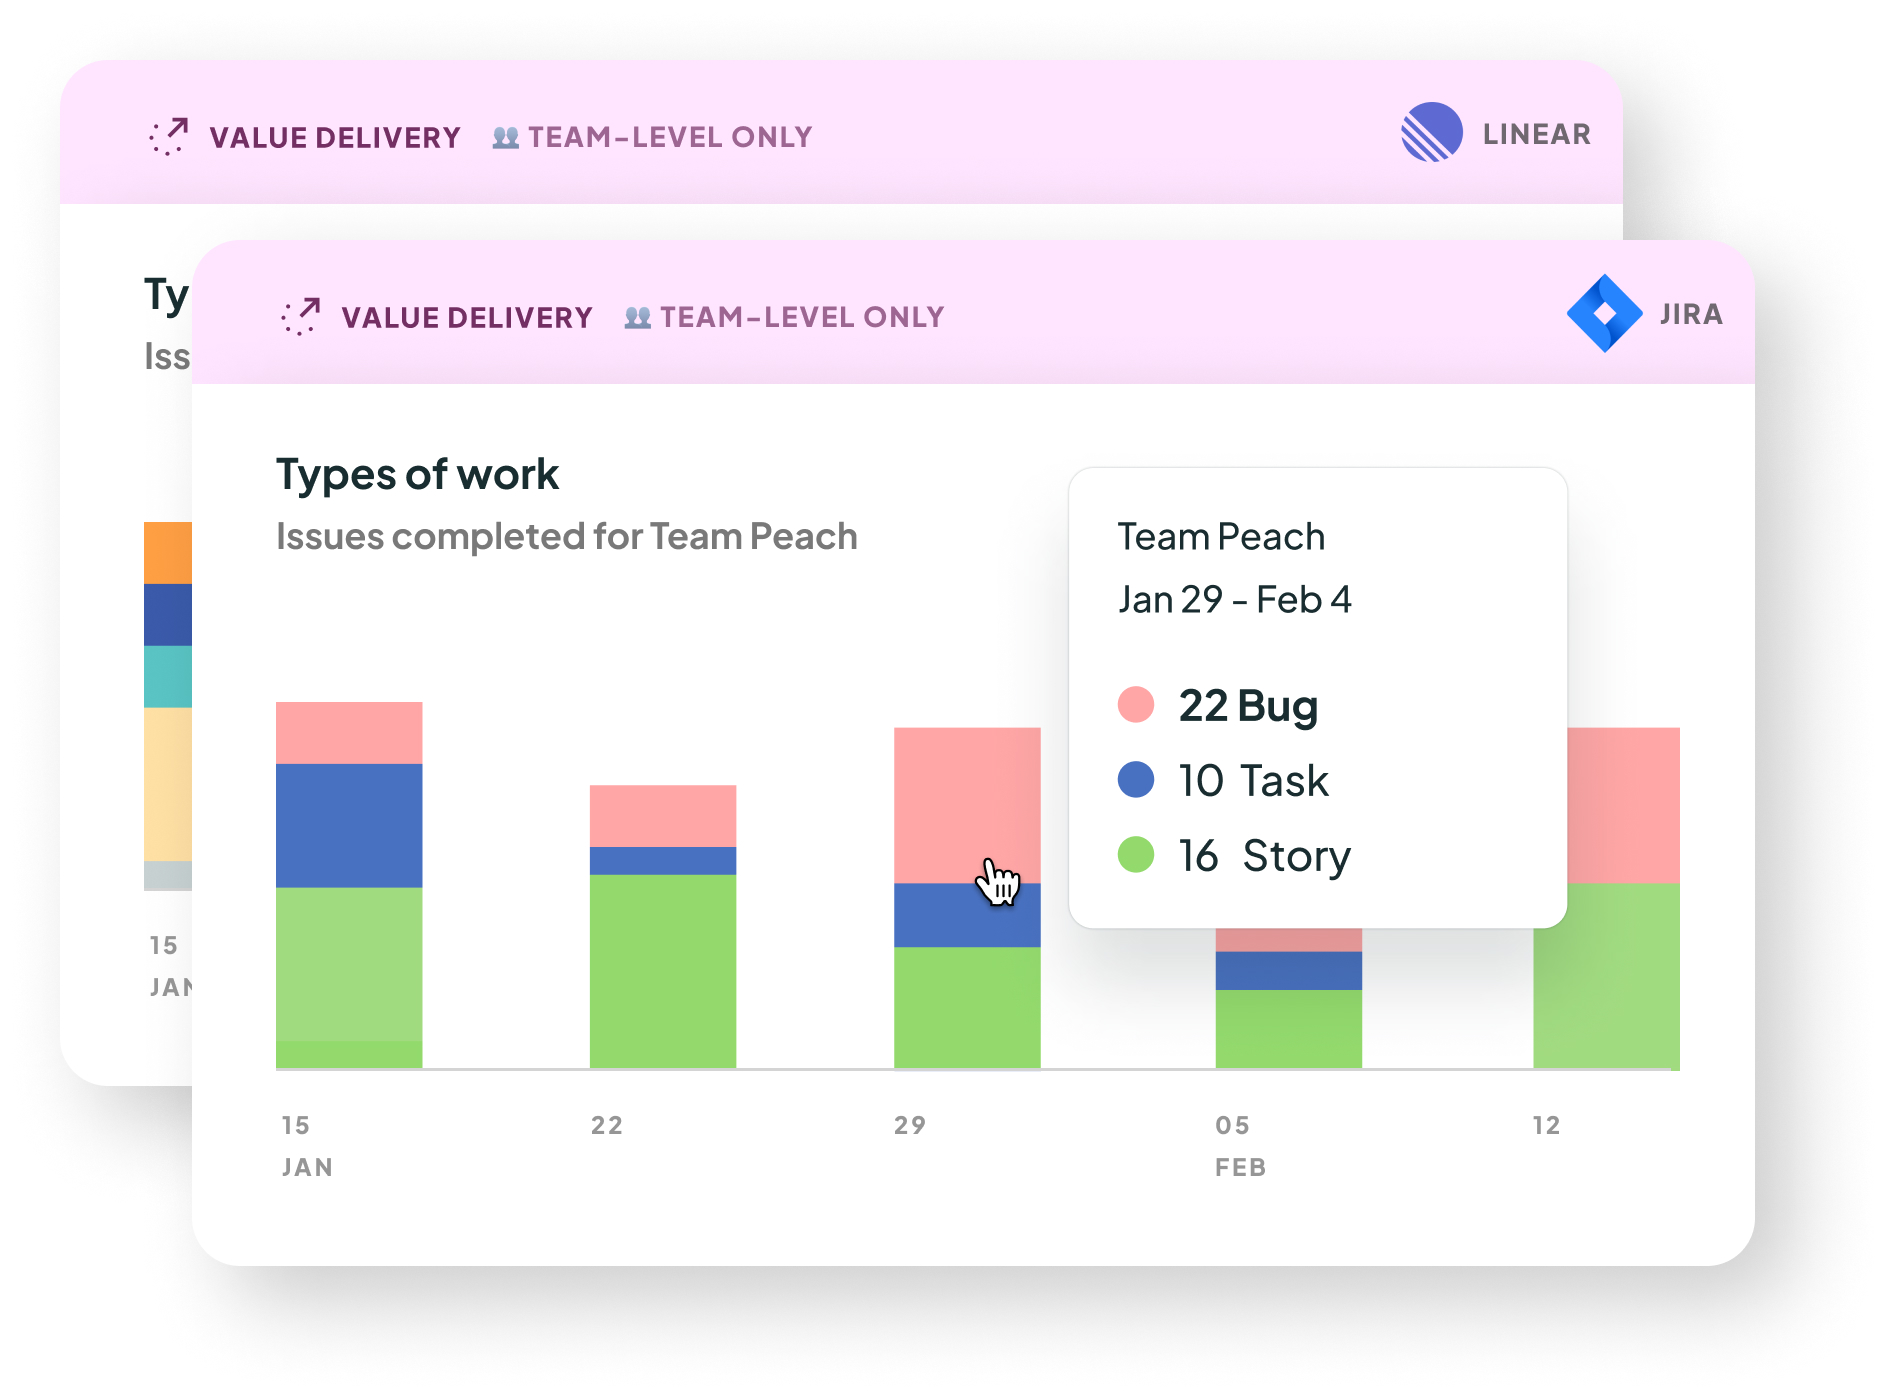
Types of Work
Note: this metric is only shown at a team level, not an individual level.

What it is: This shows how much of each type of work the team completed. To understand more about how “work” and “completed” are defined and customized, click here. You can hover over a specific section of the bar chart to get more details on how many tickets were dedicated to that task.
Why it matters: This metric gives you visibility over team velocity and how the team’s work was spread across different types of work. If a team is struggling to get their planned feature work done, this is a useful chart to consult to see what could be getting in the way, and understanding if the types of issues completed align with what was planned.
When people are interrupted on a project, it can take up to 23 minutes to get back on track (e.g., fully shift their thinking, remember where they left off, etc.). The more projects an individual holds, the more they therefore have to “context switch”, which can reduce overall productivity, while also increasing feelings of stress and frustration.
Across the team, the cost can really add up; one academic study found that developers working on 2+ projects spend 17% of their development effort on managing interruptions.
Did the team have enough time for feature work or did bug work get in the way? In one survey of ~1000 developers, 44% said bugs were a key pain point in their day-to-day work and a main reason deployments were slow.
How we calculate it: this depends on your configuration, please click here.
Note: The chart displays the top 5 projects by issue count. Projects beyond the top 5 are aggregated and shown as "Other projects" to maintain clarity and focus on the most significant work areas.
What good looks like
This depends on your team and product priorities. Many teams value consistency week-to-week, since it helps with their planning. It can also be helpful to watch for increases in bug work, since that can decrease the team’s time for feature work.
Overall, the goal of this chart is to make sure your team is working on the most important thing(s) and getting work done at a reasonable pace.
Last updated
Was this helpful?

