LogoLogo
  • Getting started
    • Welcome
    • Introduction to Multitudes
    • How Multitudes Works
  • Configuration & Setup
    • Setup: Integration Permissions
    • Permissions and roles
    • Adding Users & Teams
    • Configuring your Team
    • User Linking
    • Configuring Working Hours
    • Customize Work Categories
    • Alerts Configuration
    • Customize Targets
  • Metrics & Definitions
    • Multitudes Insights
    • Our Approach to Metrics
    • Process Metrics
      • Flow of Work
        • Change Lead Time
        • Coding Time
        • Review Wait Time
        • Editing Time
        • Deploy Time
        • PR Size
        • Focus Time
      • Value Delivery
        • Deployment Frequency
        • Merge Frequency
        • Types of Work
        • Feature vs Maintenance Work
      • Quality of Work
        • Change Failure Rate
        • Mean Time to Recovery
        • Mean Time to Acknowledge
        • Number of Pages
        • Deployment Failure Rate
    • People Metrics
      • Wellbeing
        • Out-of-Hours Work
        • Page Disruptions
        • Meeting Load
      • Collaboration
        • PR Participation Gap
        • PR Feedback Given
        • PR Feedback Received
        • Feedback Flows
        • Feedback Quality
    • Deployment Metrics
  • Integrations
    • Deployments API
    • GitHub Actions
    • Google Calendar
    • Outlook Calendar
    • Jira
    • Linear
    • Opsgenie
    • PagerDuty
    • Slack
  • Knowledge base
    • Annotations
    • Exporting your data
    • Types of Alerts
      • Daily Blocked PRs alert
      • Trend Summary alert
      • Multitudes AI Coach
      • 1:1 Prompts
      • Annotations alert
    • Troubleshooting Missing Commits
    • Bot Activity
    • Collaborative PRs & All PRs Toggles
  • Account Management
    • Billing & Payments
    • Security & Privacy
Powered by GitBook

© Multitudes 2025

On this page

Was this helpful?

  1. Metrics & Definitions
  2. Process Metrics
  3. Quality of Work

Number of Pages

PreviousMean Time to AcknowledgeNextDeployment Failure Rate

Last updated 4 months ago

Was this helpful?

Note: this metric is only shown at a team level, not an individual level.
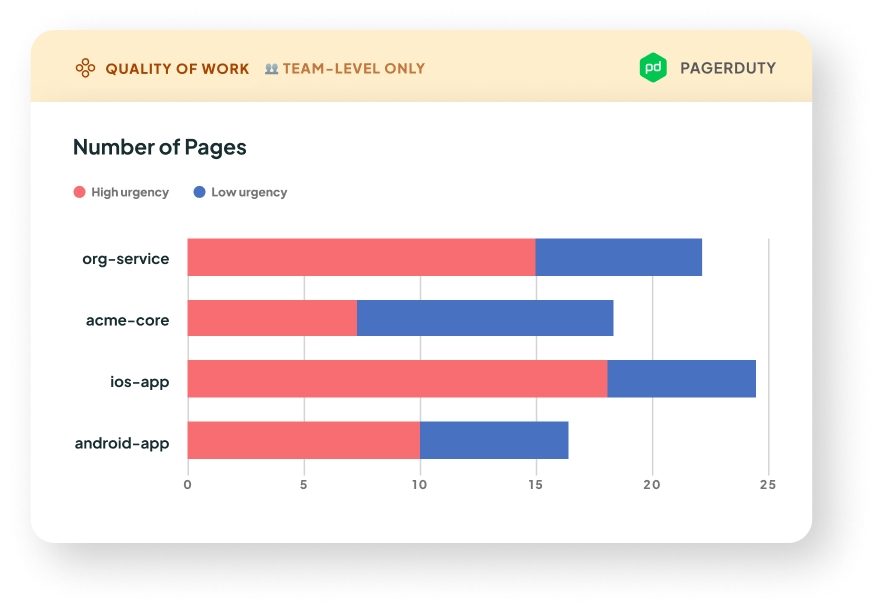
Number of Pages graph

What it is: This is the number of pages grouped by service or escalation policy. You will need to to get this metric.

🌱 Coming soon to our OpsGenie integration

Why it matters: This metric indicates the stability of your teams’ software. More pages means more incidents, and therefore disruptions to your team's focus. By looking at which services and escalation policies are generating the most pages, you can tune your monitoring to ensure that the pages you get are high signal.

How we calculate it: We count the number of unique incident.acknowledged events that occurred within the selected date range. We then group by service or escalation policy, and stacked by urgency or priority based on the filter at the top of the Quality of Work page. ‍ One incident may have multiple pages, and therefore multiple acknowledgements. These are counted separately. If an incident was resolved without getting acknowledged, we count the incident.resolved event as the acknowledgement for that incident.

This metric is not available on historical data, because we don't have access to the incident's history of events.

Incidents with the keyword [test] in the title (case insensitive) will not be processed.

What good looks like

Generally, fewer pages means fewer things getting broken in production! However, what's most important is that the pages you do get are indeed significant outages that are worth a wake-up call, and not false alarms.

Click on the stacked bars to see if the pages look like signal, or noise.

integrate with PagerDuty