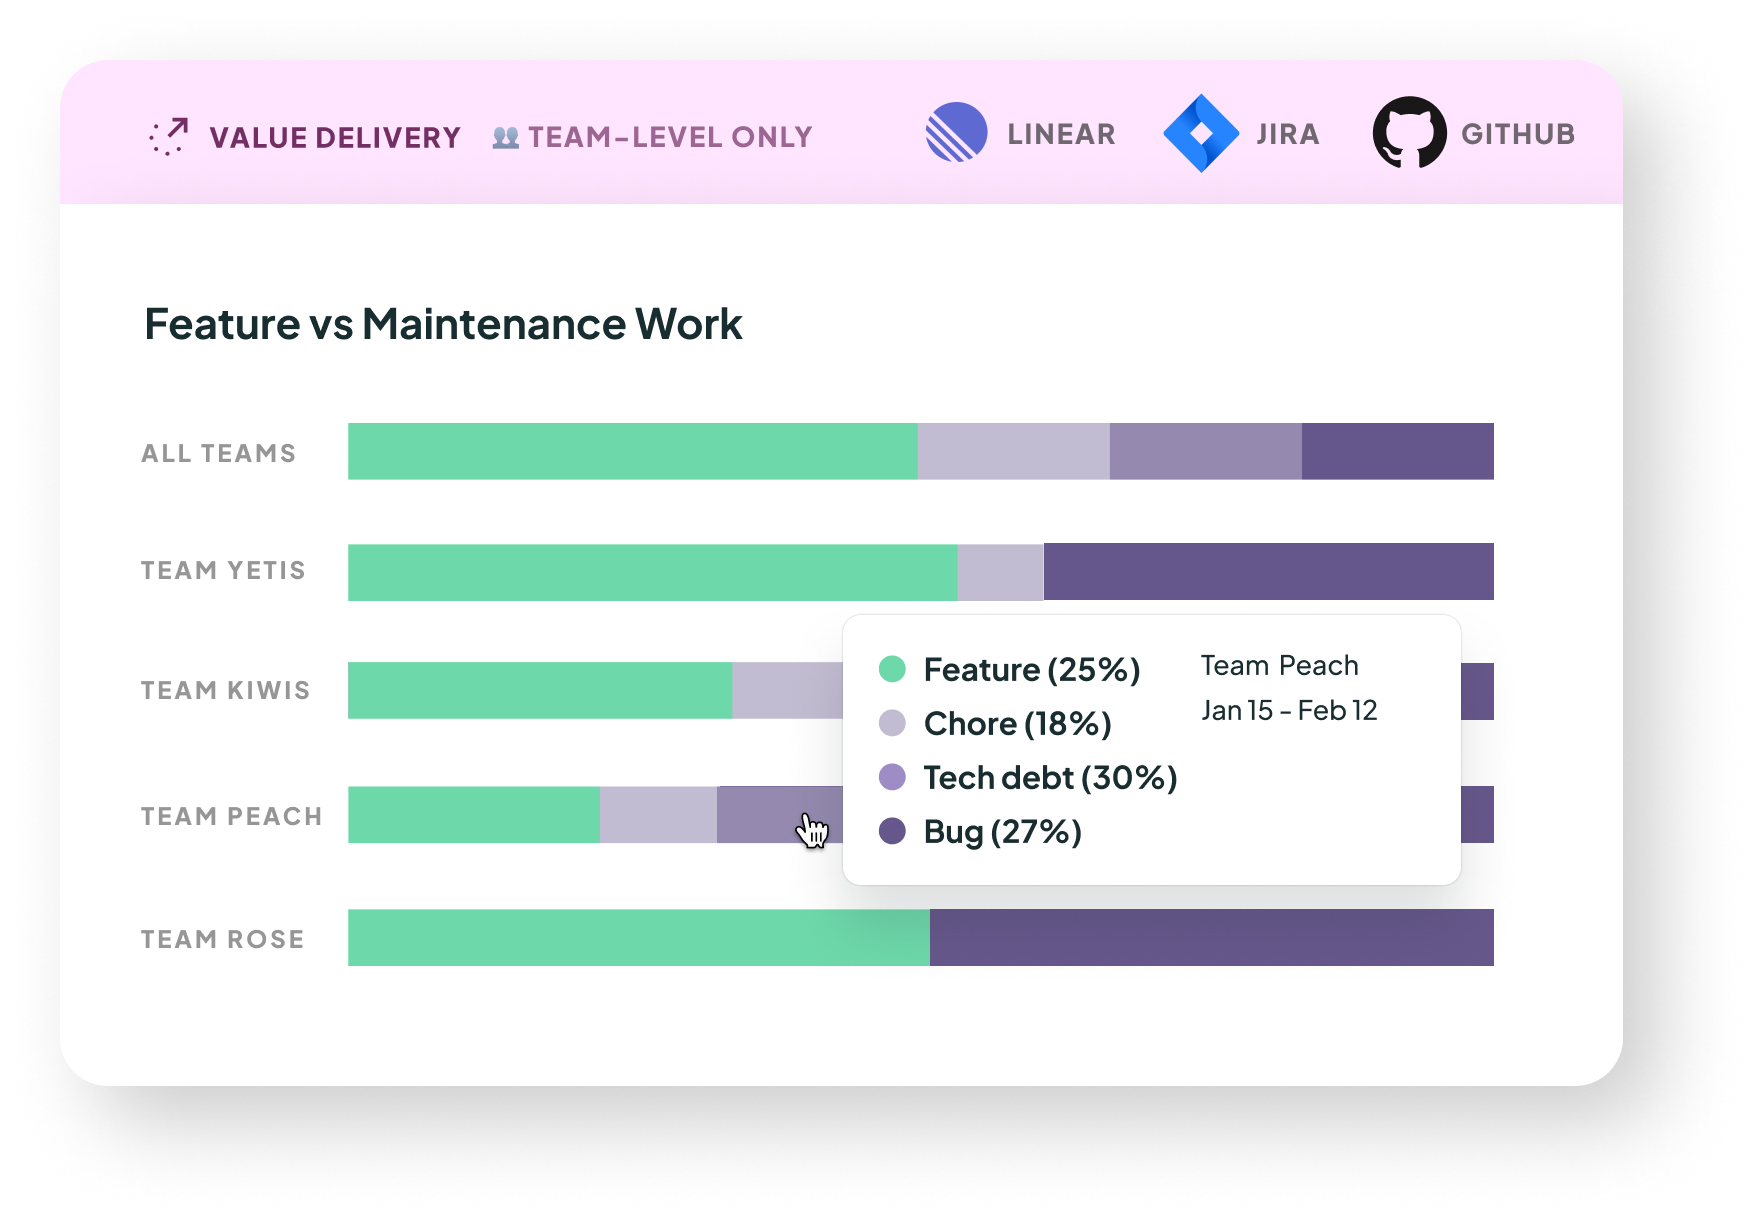
Feature vs Maintenance Work
Issue-tracking
Note: this metric is only shown at a team level, not an individual level.

What it is: This shows the relative percentage of either Feature or Maintenance work completed. For more information, see How we calculate it below.
Why it matters: Delivery is about managing the balance between shipping new features and maintaining existing systems. If you neglect maintenance, your codebase and systems can “rot”, slowing down delivery of new features and site reliability. On the other hand, spending too much time on maintenance can cause the team to miss delivery targets.
This is why visibility over where your team is spending their time is important, to make sure that the balance reflects your priorities.
How we calculate it: We may show multiple Feature vs Maintenance charts, depending on whether you have issue tracking integration(s) installed:
For our Jira or Linear integration: this depends on your configuration. Click here to understand more about how we define what is considered “work” and when it is considered "complete".
For our GitHub integration: this is based on all commits with conventional commit prefixes.
This includes all commits, not just the commits that are merged into production (which may be squashed commits).
You can filter for just conventional commits and/or just the commits on each repository's default branch with the toggles above the chart.
For the moment, we have set the default mapping using the most common conventional commit prefixes to our categories as follows:
Feature:
feat,perfInvestment:
build,ci,chore,docs,refactor,style,testBug:
fixUnassigned: all other commits e.g. if they use a different prefix, or don’t follow the conventional commits format.
You can customize the categories. Click the "Edit Categories" link under the legend, and either choose an existing category to "Edit", or "Add category".
You may select the prefixes counted towards a particular category using the dropdown of common conventional commit prefixes. Prefixes that are already used in another category will be disabled.
You can also type your own custom prefix strings. Press enter after typing each one.
There is also a checkbox labeled "Include GitHub revert commits in this category". This is for catching the commits created via the "revert" button on the GitHub UI, which creates a PR (and therefore an eventual commit if the PR is squash merged) in the format Revert "feat: old PR title with conventional prefix".
What good looks like
Many teams set aside an upfront “tech debt budget” or “maintenance budget” when planning upcoming work. Many will allocate 10-20% for maintenance, but this depends on the team. For example, teams focused on maintaining legacy code might budget 50% of work (whether story points or issues or commits) to maintenance.
Another approach is to allocate specific days, such as 1 day every week or fortnight. To learn more check out this article on how to define and spend your tech debt budget and this one on reclaiming tech equity.
Once you have defined a budget, it’s easy to use this chart to track real world “spend”!
Last updated
Was this helpful?

