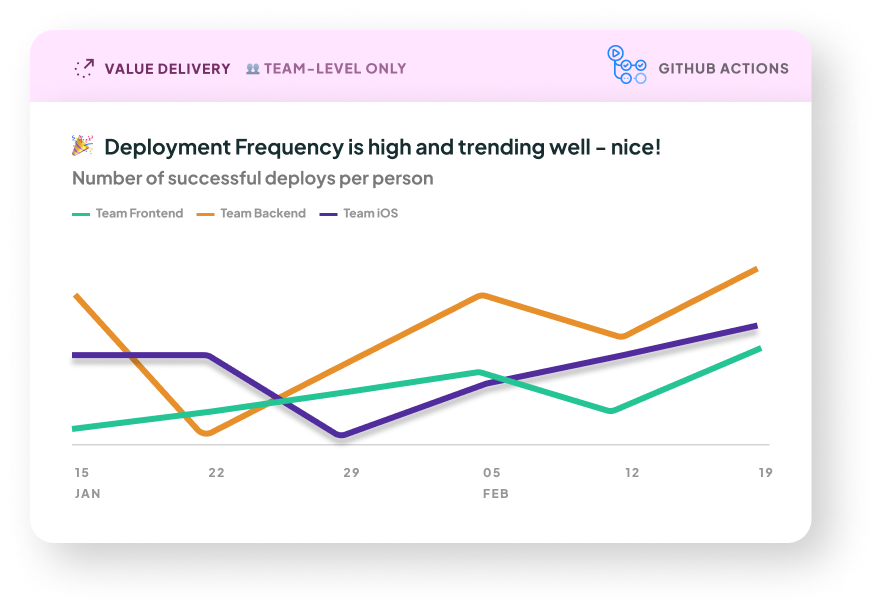
Deployment Frequency
⭐️ This metric is one of the 4 Key Metrics published by Google's DevOps Research and Assessment (DORA) team.
You can see all 4 key DORA metrics on the DORA Metrics page of the Multitudes app.
Note: this metric is only shown at a team level, not an individual level.

What it is: This is DORA's Deployment Frequency, showing the median number of successful attempts to deploy to production per person on a team, over time.
Why it matters: This is an indicator of the value we're providing to customers, because it shows the volume of work being released to production.
How we calculate it: We count the number of successful attempts to deploy to production in each time period, divided by the number of people on the team. This normalization is to allow benchmarking of teams against industry standards, regardless of team size.
Notes:
If you send us a deployment with only bot commits, and those bot commits were last updated before you installed our GitHub integration, those custom deployments will not show up in the data. This is because we don't retrieve bot commits during the initial historical data pull when you first onboard.
Commits that are authored by users who are not a contributor in Multitudes will be filtered out of results. If a deployment has no commits authored by Multitudes contributors, the whole deployment will be filtered out of results as we won't be able to attribute it to a Multitudes contributor nor their team.
If a deployment only has commits authored by bots, these will be included in the grey Organization line only.
What good looks like
In Google's DORA research, the top 15% have a Deployment Frequency that is on demand, with multiple deploys per day (see DORA 2025). If we call that one deploy per day per team, that’s 5 deploys per week in a 5-day workweek. We recommend keeping this metric over 2 deployments per person per week.
Last updated
Was this helpful?

