Annotations
What are annotations?
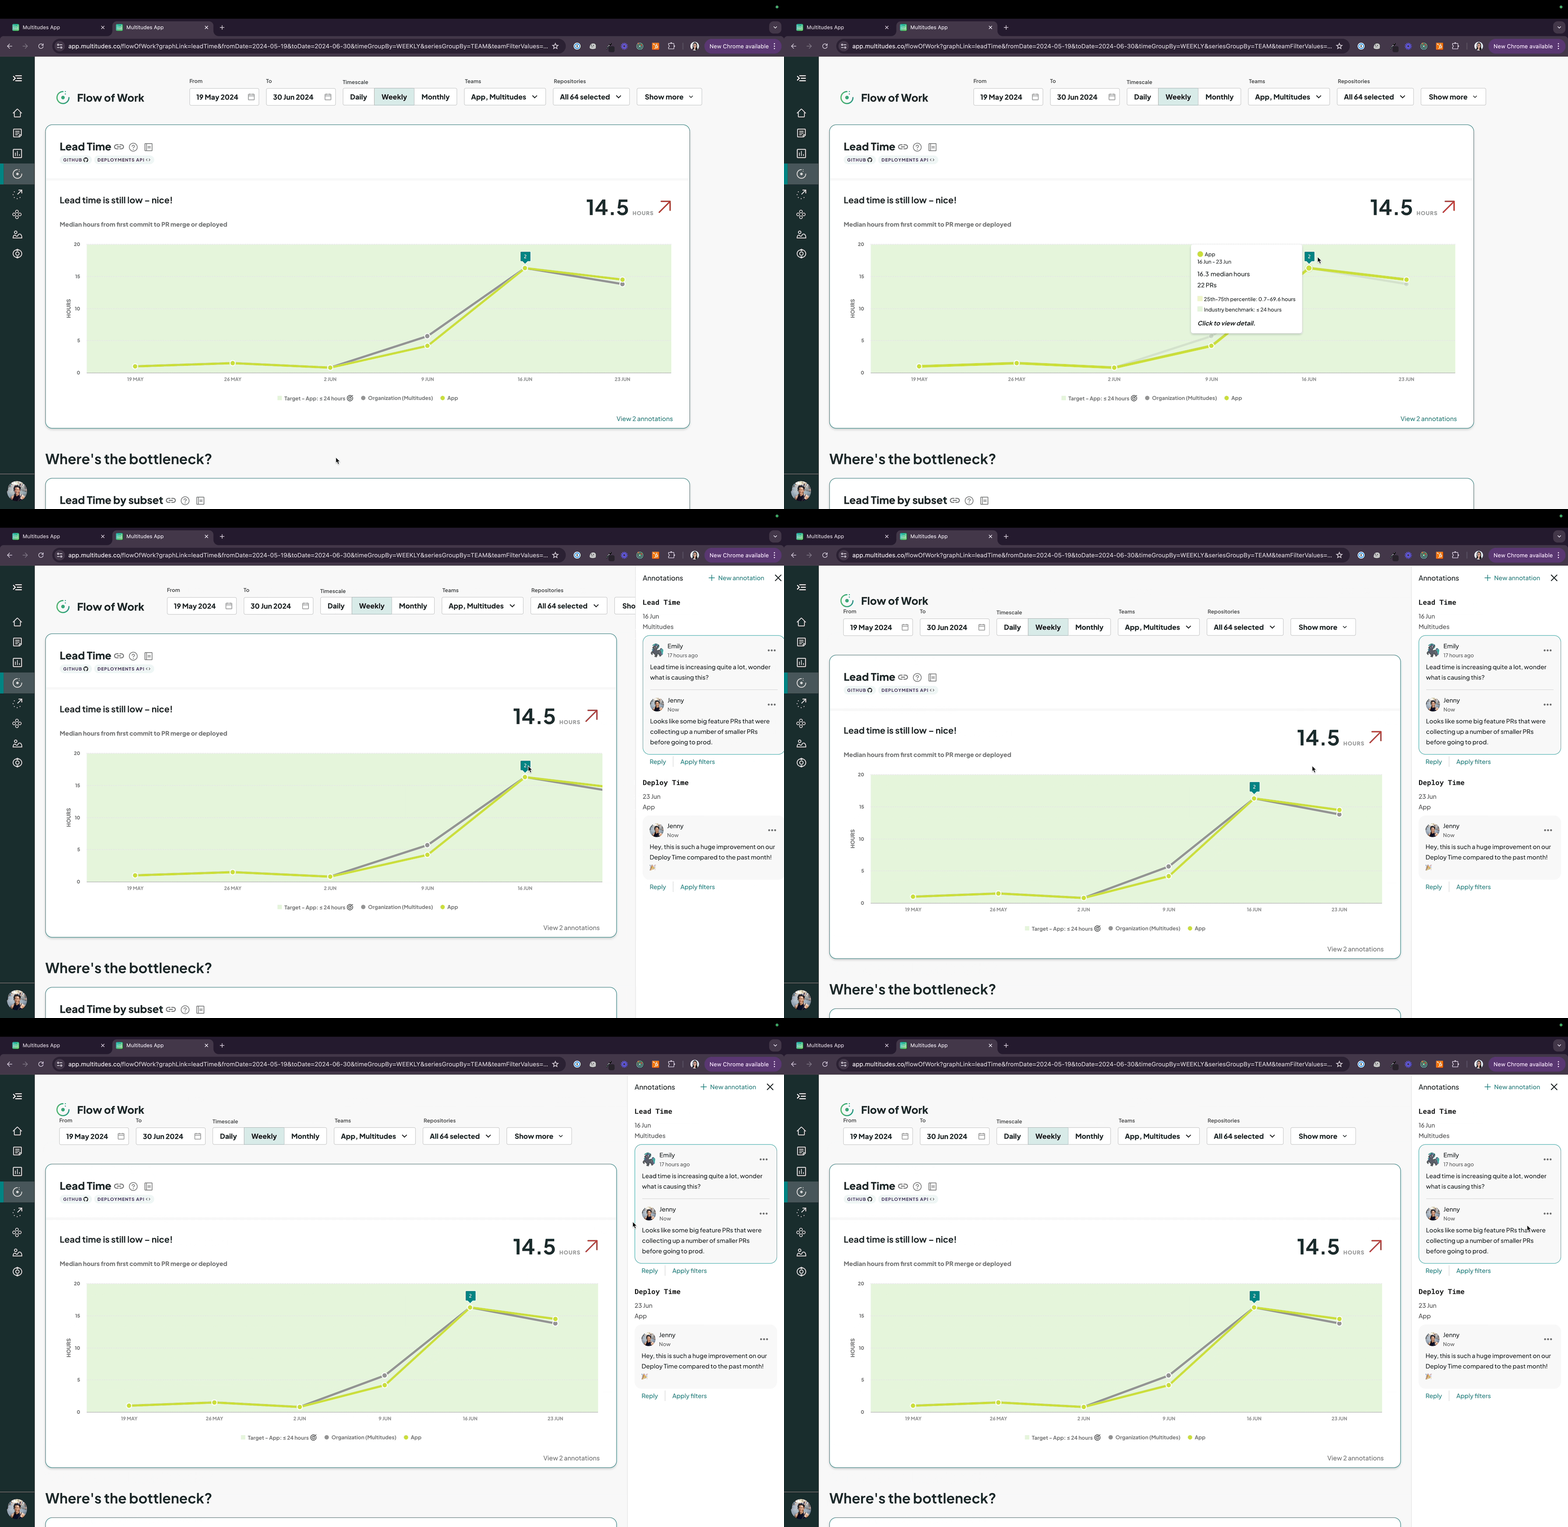
Annotations allow you to add context to your data. Users can annotate chart data points, view annotations in a sidebar, and reply to annotations to have threaded discussions with team members.
On line charts, they appear as bubbles on specific data points with a number indicating the number of comments associated with that data point.
Create an annotation
Add annotations in the following ways:
If a chart that doesn’t have any annotations in the current view: click the
Add annotationlink in the bottom-left corner of the chart.If a chart has annotations visible: click the
View [N] annotationslink in the bottom-left corner of the chart, then click the+ New annotationbutton at the top of the sidebar.

Annotations are associated with a specific chart, date, and team. They will appear on the relevant data point on the chart, i.e. on the specific series (the team's line, for a line chart), and in the month/week/day data point that the date is included in.
For charts that are not grouped by team (anything that’s not a simple line chart with one line representing a team), you will be required to enter a date range that the annotation is relevant for. These annotations will not appear on the chart, but just be visible in the sidebar via the View [N] annotations link.
You can only edit and delete your own annotations.
View annotations in the sidebar

Open the Annotations sidebar by clicking Add annotation or View [N] annotation on any chart.
The annotations listed in the sidebar are specific to the selected page, and the filters that are set on the page: the date range, and the filtered teams.
Users can
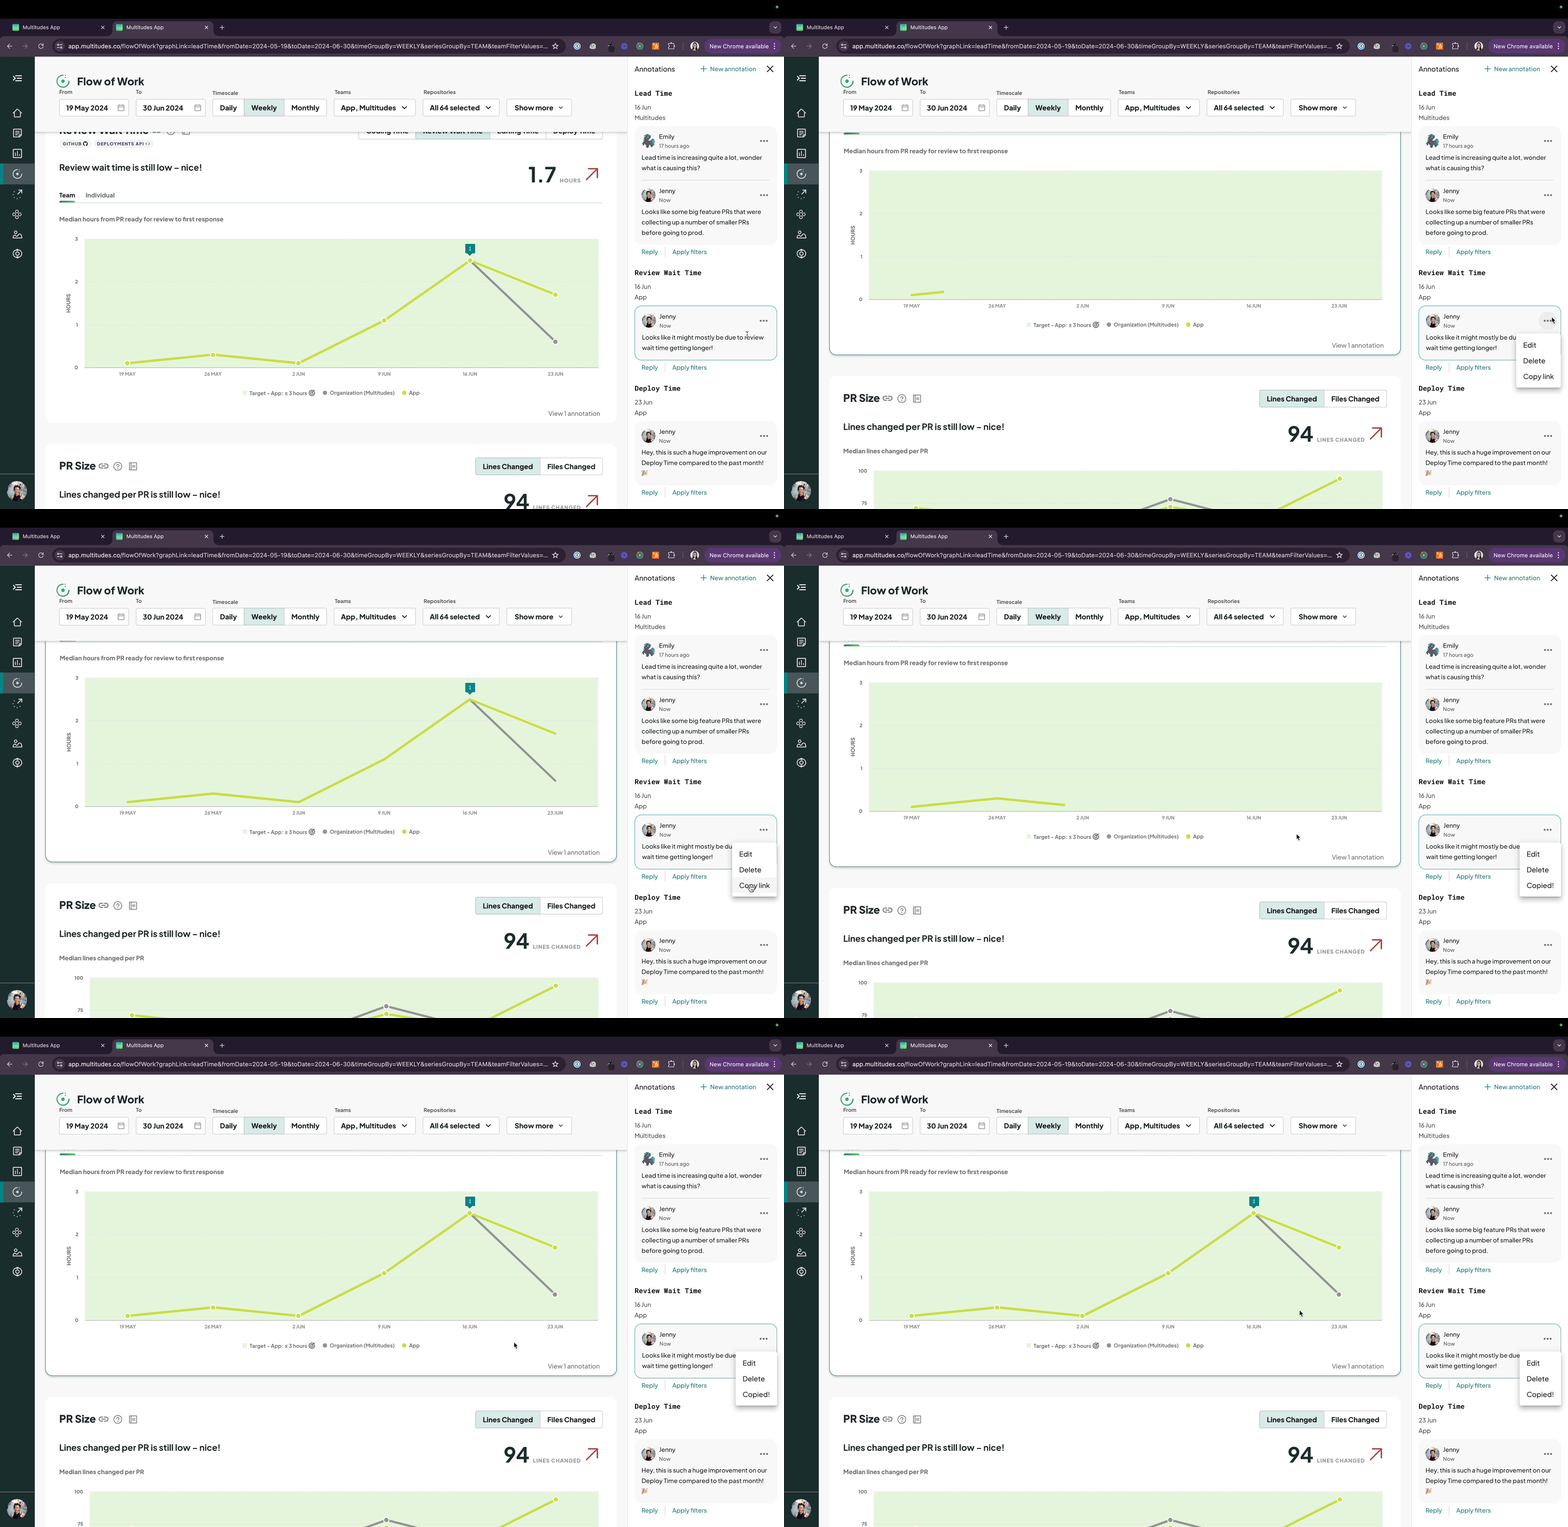
Replyto annotations, creating threaded conversations.Click the
Apply filterslink next toReplyto reset the filters at the top of the page to what the original annotation author had been seeing*.Click the
…menu next to a comment and selectCopy linkto share a particular comment and the specific filters that were in place when the annotation was made*.Click an annotation in the sidebar to highlight the relevant chart.
Click an annotation bubble on a chart to highlight the corresponding annotation in the sidebar.

*This is for you to see the same data that the author was seeing, so that any trends or data numbers that they refer to make sense.
Notifications
Learn about annotation notifications on our Types of Alerts page.
Last updated
Was this helpful?

