LogoLogo
  • Getting started
    • Welcome
    • Introduction to Multitudes
    • How Multitudes Works
  • Configuration & Setup
    • Setup: Integration Permissions
    • Permissions and roles
    • Adding Users & Teams
    • Configuring your Team
    • User Linking
    • Configuring Working Hours
    • Customize Work Categories
    • Alerts Configuration
    • Customize Targets
  • Metrics & Definitions
    • Multitudes Insights
    • Our Approach to Metrics
    • Process Metrics
      • Flow of Work
        • Change Lead Time
        • Coding Time
        • Review Wait Time
        • Editing Time
        • Deploy Time
        • PR Size
        • Focus Time
      • Value Delivery
        • Deployment Frequency
        • Merge Frequency
        • Types of Work
        • Feature vs Maintenance Work
      • Quality of Work
        • Change Failure Rate
        • Mean Time to Recovery
        • Mean Time to Acknowledge
        • Number of Pages
        • Deployment Failure Rate
    • People Metrics
      • Wellbeing
        • Out-of-Hours Work
        • Page Disruptions
        • Meeting Load
      • Collaboration
        • PR Participation Gap
        • PR Feedback Given
        • PR Feedback Received
        • Feedback Flows
        • Feedback Quality
    • Deployment Metrics
  • Integrations
    • Deployments API
    • GitHub Actions
    • Google Calendar
    • Outlook Calendar
    • Jira
    • Linear
    • Opsgenie
    • PagerDuty
    • Slack
  • Knowledge base
    • Annotations
    • Exporting your data
    • Types of Alerts
      • Daily Blocked PRs alert
      • Trend Summary alert
      • Multitudes AI Coach
      • 1:1 Prompts
      • Annotations alert
    • Troubleshooting Missing Commits
    • Bot Activity
    • Collaborative PRs & All PRs Toggles
  • Account Management
    • Billing & Payments
    • Security & Privacy
Powered by GitBook

© Multitudes 2025

On this page

Was this helpful?

  1. Metrics & Definitions
  2. Process Metrics
  3. Value Delivery

Merge Frequency

PreviousDeployment FrequencyNextTypes of Work

Last updated 4 months ago

Was this helpful?

Note: this metric is only shown at a team level, not an individual level.
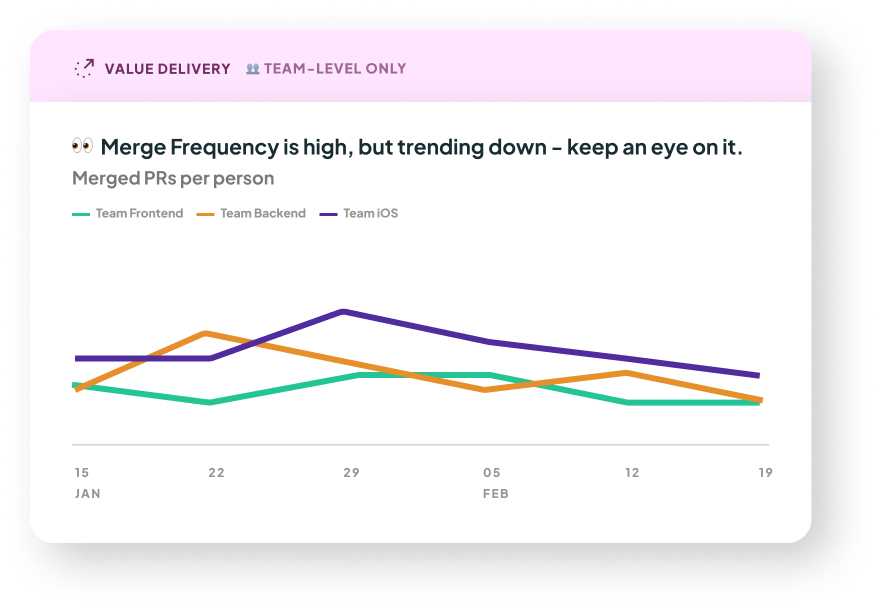
Merge Frequency graph

What it is: This is an alternative to DORA's Deployment Frequency. It shows the median number of PRs merged per person on a team, over time.

Why it matters: This is an indicator of the value we're providing to customers, because it shows the volume of work being released to production. It can be useful to measure both Merge Frequency and Deployment Frequency. While it is best practice for each merge to automatically deploy to prod, often this is not the case - maybe your deploy pipeline is not yet fully automated, or it takes a while to deploy so you often want to batch changes. A significant difference between these two measures might indicate opportunities for improvement in your deployment processes.

How we calculate it: We count the number of PRs merged in each time period, divided by the number of people on the team. This normalization is to allow benchmarking of teams against industry standards, regardless of team size. You can filter for only collaborative PRs (ones that had input from someone other than the PR author) using the Collaborative PRs toggle.

What good looks like

Google suggests that elite teams should be deploying multiple times a day. If we call that one deployment per day per team, that’s 5 deploys per week in a 5-day work week. Dividing this by a rough approximation of team size (around 5 developers), and taking into account the fact that there's sometimes more than one PR included in a single deploy (for major features, it could be best practice to collect up lots of changes into a release branch), we recommend keeping this metric over 2 PRs merged per person per week.