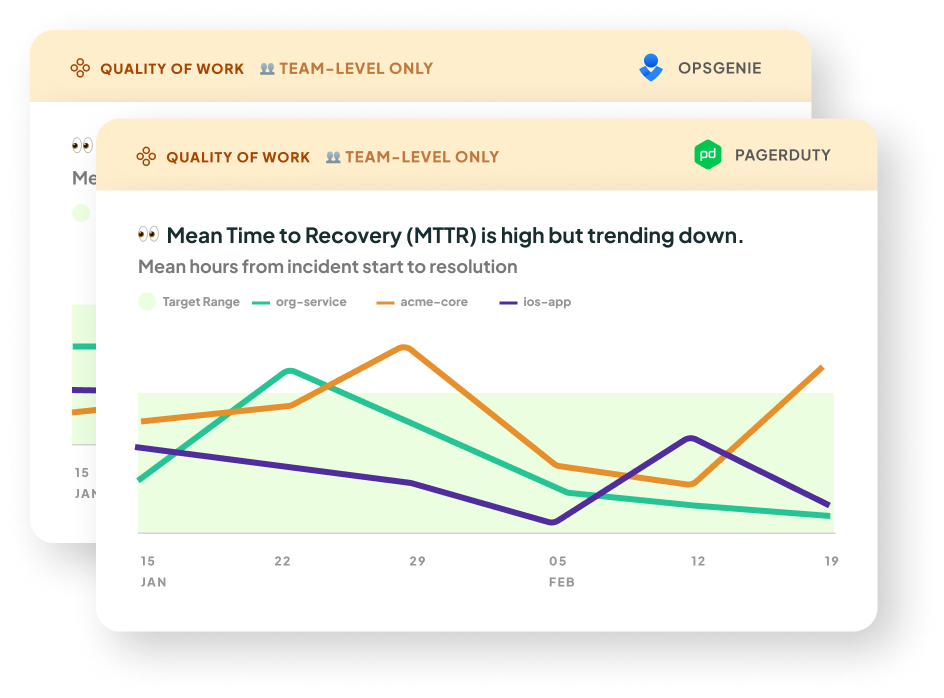
Mean Time to Recovery
⭐️ This metric is one of the 4 Key Metrics published by Google's DevOps Research and Assessment (DORA) team.
You can see all 4 key DORA metrics on the DORA Metrics page of the Multitudes app.
Note: this metric is only shown at a team level, not an individual level.

What it is: This is our take on DORA's Mean Time to Recovery metric. It's a measure of how long it takes an organization to recover from an incident or failure in production. You will need to integrate with OpsGenie or PagerDuty to get this metric.
Why it matters: This metric indicates the stability of your teams’ software. A higher Mean Time to Recovery increases the risk of app downtime. This can further result in a higher Change Lead Time due to more time being taken up fixing outages, and ultimately impact your organization's ability to deliver value to customers. In this study by Nicole Forsgren (author of DORA and SPACE), high performing teams had the lowest times for Mean Time to Recovery. The study also highlights the importance of organizational culture in maintaining a low Mean Time to Recovery.
How we calculate it: We take a mean of the recovery times for the incidents that occurred in the selected date range, for the selected cadence (e.g. weekly, monthly). The line chart series are grouped by Multitudes team for Opsgenie, and Service or Escalation policy for PageDuty.
The recovery time is calculated as follows:
On OpsGenie: the time from when an incident was opened to when it was closed.
On PagerDuty: the time from the first incident.triggered event* to the first incident.resolved event. We attribute the incident to the team(s) of the resolver; this is the user who triggered the first incident.resolved event. This is how we determine whether to show an incident based on the team filters at the top of the page**.
*If a trigger event can not be found, we default to the incident's created date. This is the case for historical data (the data shown when you first onboard).
Also, in historical data, the resolver is assumed to be the user who last changed the incident status; you can't un-resolve an incident, so for resolved incidents this can be assumed to be the responder.
**If an incident was resolved by a bot, here's how they are shown in the data:
Incidents resolved by bot, with no assignee in its history: only shown when the
Teamsfilter at the top of the page is set to showing the whole organization.Incidents resolved by bot, with an assignee who is a Multitudes contributor: shown & attributed to the team(s) of that assignee. If there are multiple assignees, or there were multiple assignees throughout the history of the incident (e.g. it was reassigned), we take the last assignee(s)' team(s).
Incidents resolved by a Multitudes contributor: shown & attributed to the team(s) of the resolver.
Incidents resolved by a user who’s not a contributor: not shown.
What good looks like
In Google's DORA research, the top 15th percentile recover from failures in less than one hour (see DORA 2025).
Note that DORA now tracks Failed Deployment Recovery Time (FDRT), which is very similar to Mean Time to Recovery. The difference is that FDRT only includes failures caused by a change the team made, whereas MTTR looks at recovery from all failures (read more about the difference here). We continue to track MTTR because many organizations still use it for reporting.
Last updated
Was this helpful?

