LogoLogo
  • Getting started
    • Welcome
    • Introduction to Multitudes
    • How Multitudes Works
  • Configuration & Setup
    • Setup: Integration Permissions
    • Permissions and roles
    • Adding Users & Teams
    • Configuring your Team
    • User Linking
    • Configuring Working Hours
    • Customize Work Categories
    • Alerts Configuration
    • Customize Targets
  • Metrics & Definitions
    • Multitudes Insights
    • Our Approach to Metrics
    • Process Metrics
      • Flow of Work
        • Change Lead Time
        • Coding Time
        • Review Wait Time
        • Editing Time
        • Deploy Time
        • PR Size
        • Focus Time
      • Value Delivery
        • Deployment Frequency
        • Merge Frequency
        • Types of Work
        • Feature vs Maintenance Work
      • Quality of Work
        • Change Failure Rate
        • Mean Time to Recovery
        • Mean Time to Acknowledge
        • Number of Pages
        • Deployment Failure Rate
    • People Metrics
      • Wellbeing
        • Out-of-Hours Work
        • Page Disruptions
        • Meeting Load
      • Collaboration
        • PR Participation Gap
        • PR Feedback Given
        • PR Feedback Received
        • Feedback Flows
        • Feedback Quality
    • Deployment Metrics
  • Integrations
    • Deployments API
    • GitHub Actions
    • Google Calendar
    • Outlook Calendar
    • Jira
    • Linear
    • Opsgenie
    • PagerDuty
    • Slack
  • Knowledge base
    • Annotations
    • Exporting your data
    • Types of Alerts
      • Daily Blocked PRs alert
      • Trend Summary alert
      • Multitudes AI Coach
      • 1:1 Prompts
      • Annotations alert
    • Troubleshooting Missing Commits
    • Bot Activity
    • Collaborative PRs & All PRs Toggles
  • Account Management
    • Billing & Payments
    • Security & Privacy
Powered by GitBook

© Multitudes 2025

On this page

Was this helpful?

  1. Metrics & Definitions
  2. Process Metrics
  3. Flow of Work

Deploy Time

PreviousEditing TimeNextPR Size

Last updated 4 months ago

Was this helpful?

Note: this metric is only shown at a team level, not an individual level.
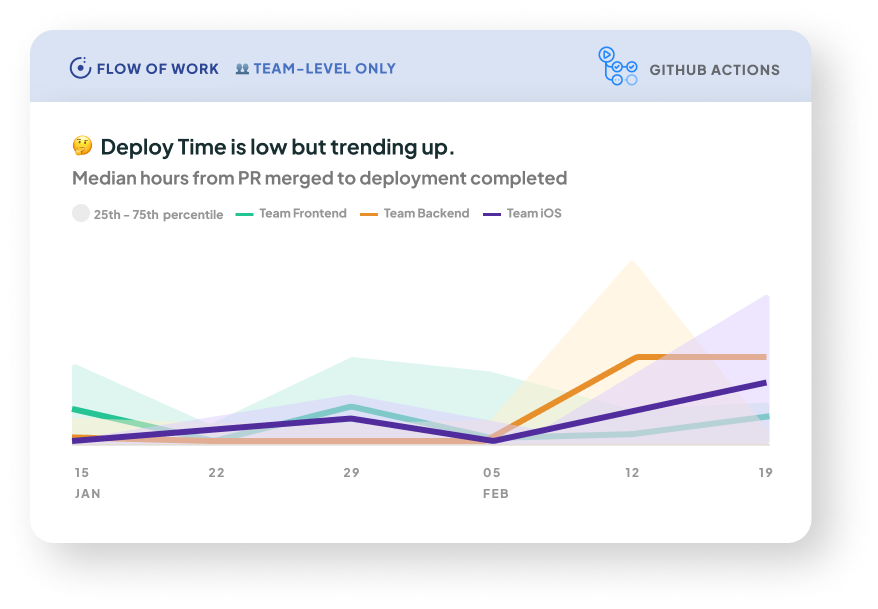
Deploy Time line graph

‍What it is: This metric shows how long code takes to get deployed once a PR has been merged.

Why it matters: Deploy Time measures how fast new features, bug fixes, and hot-fixes can reach end-users. A lengthy build or deployment process can delay crucial updates, hinder customer satisfaction, and even impact the overall competitiveness of a product or service. By minimizing Deploy Time, organizations can ensure a faster time-to-market.

A long Deploy Time also has a direct impact on developer productivity and well-being. As this can introduce frustration and inefficiency, leading to a decline in developer morale and motivation. When developers have to wait for long periods to see their code build, it can disrupt their workflow and hinder their ability to iterate and make further improvements.

A few notes:

How we calculate it: The number of minutes from when a PR is merged to when an succeeds.

If you have GitHub Actions set up, see for info on how the way you use and configure this integration will appear in your data

If you’re using our , the commitSha is what we’ll use to match deployments to PRs

attempt to deploy it to production
here
Deployments API