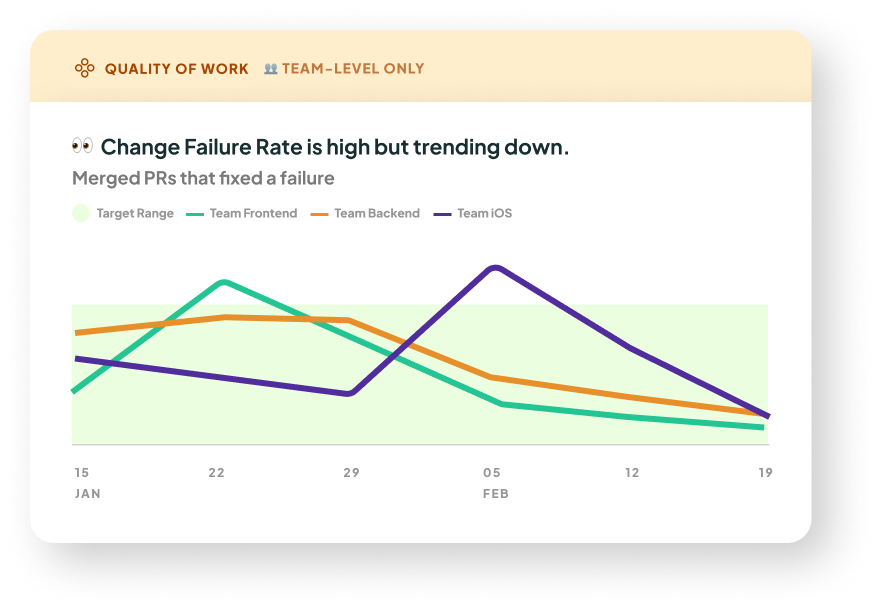
Change Failure Rate
⭐️ This metric is one of the 4 Key Metrics published by Google's DevOps Research and Assessment (DORA) team.
You can see all 4 key DORA metrics on the DORA Metrics page of the Multitudes app.
Note: this metric is only shown at a team level, not an individual level.

What it is: The percentage of PRs merged that indicate that some kind of failure was released and had to be fixed.
Why it matters: This is our take on DORA's Change Failure Rate, which indicates the percentage of deployments that cause a failure in production. It's a lagging indicator of the quality of software that is being deployed - how often does it contain bugs that cause failures later?
How we calculate it: We calculate the % of merged PRs that contain any of the words rollback, hotfix, revert, or [cfr] in the PR title, out of all merged PRs. We tested and chose these keywords to catch most cases where a PR was required to fix a previously-released bug, while minimizing false positives.
Tip: Use a script to automatically add [cfr] to PRs that meet certain criteria
In the future we will allow customization of which key words we take into account when determining what constitutes a change failure. In the interim if your team has established practises around naming conventions, you can use a CI script to add [cfr] to the title of PRs you wish to track in Multitudes. This example Github Actions job checks to see if the PR title contains the word fix, and if so appends [cfr] to the title.
We recognise that this proxies failures after the fact; this is because it's not actually possible to know if someone's releasing a failure into production in the moment, otherwise it wouldn't have been released in the first place!
Also, incidents are not always easily tied to a specific PR or deployment. You can include the square-bracketed keyword [cfr] in your PR titles if you'd like more granular control over what gets counted in this chart.
What good looks like
In Google's DORA research, the top 15th percentile have a Change Failure Rate of 0-4% (see DORA 2025). The DORA benchmark has changed over the years – it was 0%-5% until recently, and 0%-15% before that.
Last updated
Was this helpful?

