LogoLogo
  • Getting started
    • Welcome
    • Introduction to Multitudes
    • How Multitudes Works
  • Configuration & Setup
    • Setup: Integration Permissions
    • Permissions and roles
    • Adding Users & Teams
    • Configuring your Team
    • User Linking
    • Configuring Working Hours
    • Customize Work Categories
    • Alerts Configuration
    • Customize Targets
  • Metrics & Definitions
    • Multitudes Insights
    • Our Approach to Metrics
    • Process Metrics
      • Flow of Work
        • Change Lead Time
        • Coding Time
        • Review Wait Time
        • Editing Time
        • Deploy Time
        • PR Size
        • Focus Time
      • Value Delivery
        • Deployment Frequency
        • Merge Frequency
        • Types of Work
        • Feature vs Maintenance Work
      • Quality of Work
        • Change Failure Rate
        • Mean Time to Recovery
        • Mean Time to Acknowledge
        • Number of Pages
        • Deployment Failure Rate
    • People Metrics
      • Wellbeing
        • Out-of-Hours Work
        • Page Disruptions
        • Meeting Load
      • Collaboration
        • PR Participation Gap
        • PR Feedback Given
        • PR Feedback Received
        • Feedback Flows
        • Feedback Quality
    • Deployment Metrics
  • Integrations
    • Deployments API
    • GitHub Actions
    • Google Calendar
    • Outlook Calendar
    • Jira
    • Linear
    • Opsgenie
    • PagerDuty
    • Slack
  • Knowledge base
    • Annotations
    • Exporting your data
    • Types of Alerts
      • Daily Blocked PRs alert
      • Trend Summary alert
      • Multitudes AI Coach
      • 1:1 Prompts
      • Annotations alert
    • Troubleshooting Missing Commits
    • Bot Activity
    • Collaborative PRs & All PRs Toggles
  • Account Management
    • Billing & Payments
    • Security & Privacy
Powered by GitBook

© Multitudes 2025

On this page

Was this helpful?

  1. Metrics & Definitions
  2. Process Metrics
  3. Quality of Work

Deployment Failure Rate

PreviousNumber of PagesNextPeople Metrics

Last updated 4 months ago

Was this helpful?

Note: this metric is only shown at a team level, not an individual level.
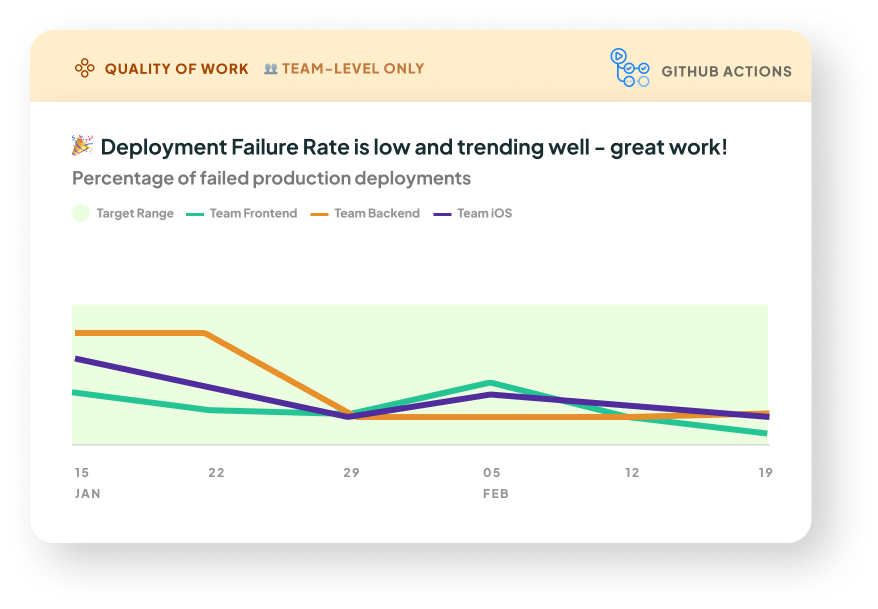
Deployment Failure Rate

What it is: The percentage of that failed (or timed out).

Note this currently is only available if you’re using the . If you’re using the , for now we only receive successful deploy attempts. In the future, we may also accept indicators of failed attempts to calculate failure rate.

Why it matters: Deployment failure rate directly impacts the efficiency of your system. High failure rates can delay feature releases, bug-fixes and contribute to frustration and stress among developers. This can also divert developers attention away from focus work and contribute to distractions.

Ideally, potential failures are caught in earlier testing environments, like dev and staging. If Deployment failure rate is high, it might mean there is not enough test coverage, or the checks you go through before triggering a prod deploy are missing some areas of the code.

How we calculate it: This rate measures failed attempts to deploy to production (which includes time outs) divided by attempts that either were successful or failed, for clarity on how this is defined, review .

here
attempts to deploy to production
GitHub Actions integration
Deployments API